
Equity Curve in Funded Trading: Your 2026 Guide
Your equity curve is the most reliable, chronological performance signal for passing and keeping a funded account. It tells you whether your edge, position sizing, and discipline will survive a prop-firm challenge before a rule breach does. Two traders can finish a challenge with identical $3,000 profit, yet one has a forward path to $20,000 and the other is heading toward zero, depending entirely on curve shape.
Your three-sentence action verdict: If your curve is trending upward with shallow pullbacks, continue at current size. If it has flattened across 30 or more trades, cut size by half immediately. If it shows a sharp spike followed by a drop, stop trading and audit your last ten trades before continuing.
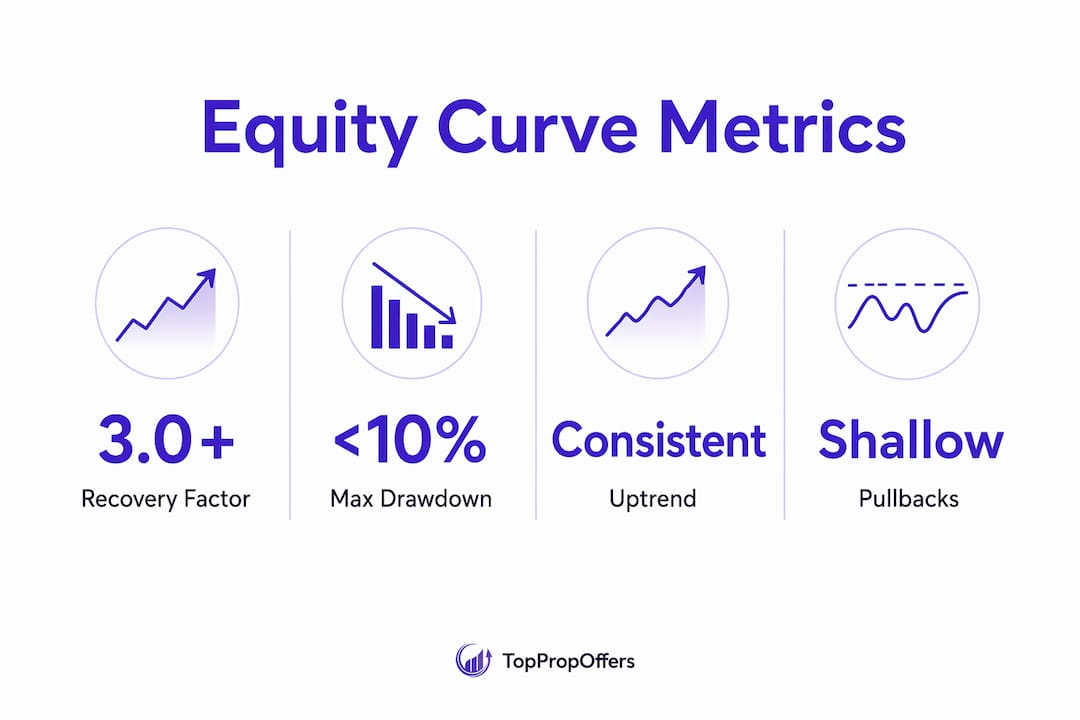
Two benchmarks matter most: a recovery factor of 3.0 or higher (net profit divided by max drawdown) signals a resilient strategy, and post-payout drawdown violations increase noticeably immediately after a payout. TopPropOffers tracks both metrics across 80+ firm rule sets for 2026.
Table of Contents
- How prop firms evaluate your equity curve during and after a challenge
- What does a healthy equity curve actually look like?
- How to protect and improve your equity curve during a challenge
- Common equity-curve traps that cause funded evaluation failures
- How challenge timelines and fees shape your curve behavior
- How equity curve swings affect your decision-making
- Tools and platforms for tracking your equity curve
- Real-world curve management: what passes and what fails
- Key Takeaways
- What TopPropOffers’ 2026 reviews show about curves that pass
- Find a firm that fits your equity-curve profile
- Useful TopPropOffers pages for firm rules and examples
- FAQ
How prop firms evaluate your equity curve during and after a challenge
Prop firms do not just check your final balance. They monitor the shape of your equity curve in real time, looking for specific rule breaches.
Common rules and how they appear on your curve:
- Max total drawdown (typically 8–10%): a single steep drop on your curve that touches this floor ends the account instantly.
- Trailing drawdown (peak-based): the floor rises as your equity rises, so a curve that climbs then falls back can breach a rule even if the absolute loss looks small.
- Max daily loss (typically 4–5%): a single vertical drop within one session triggers a fail, visible as a sharp intraday trough.
- Profit target (typically 8–10% for phase one): the curve must reach this level before the evaluation clock expires.
Evaluation sequence for a standard 1-step challenge:
- Day 1–5: curve climbs steadily, daily drawdown stays well inside limits.
- Day 6–10: a losing day pulls equity back; trailing drawdown floor rises with the prior peak, so the safe zone narrows.
- Day 11+: curve must recover and reach the profit target without touching the new, higher floor.
Pro Tip: Trailing drawdown is more dangerous than static drawdown because your safe zone shrinks every time you make a new high. Treat each new equity peak as a reset: recalculate how much room you have left before you add size.
WeMasterTrade uses a trailing drawdown structure. Check the TopPropOffers review for exact thresholds before you start. Your historical max drawdown should sit at no more than roughly 50% of the firm’s allowed limit to give yourself a statistical buffer.

| Rule type | What it checks on your curve | Trader action |
|---|---|---|
| Static total drawdown | Lowest point vs. starting balance | Keep worst trade under half the limit |
| Trailing/peak drawdown | Lowest point vs. highest equity reached | Reduce size after every new equity high |
| Max daily loss | Intraday trough depth | Set a hard daily stop before the session |
| Profit target | Curve must reach a set level by deadline | Track pace; avoid over-trading to catch up |
What does a healthy equity curve actually look like?
A healthy curve trends upward, recovers quickly from pullbacks, and never produces a single loss that dominates the chart. Here are the three shapes you need to recognize.
Staircase (ideal): Small, frequent steps up followed by shallow horizontal pauses. This pattern reflects consistent position sizing and effective stop losses. It is the most scalable shape and the one firms prefer when reviewing traders for scaling plans.
Spike-and-Crash (high risk): Sharp vertical gains followed by equally sharp drops. This usually signals over-leveraging or news trading without a plan. Even a net-positive curve in this shape raises red flags for prop-firm risk desks.
Volatile Climber (borderline): A generally upward trend with wide, irregular swings. Manageable if drawdowns stay inside firm limits, but one bad session can wipe the buffer. Filtering out low-quality setups often converts this shape into a Staircase.
| Metric | What it measures | Healthy range |
|---|---|---|
| Max drawdown | Largest peak-to-trough decline | Below roughly half of the firm’s allowed limit |
| Recovery factor | Net profit ÷ max drawdown | 3.0 or higher |
| Curve slope | Sustained upward trend | Positive across every 30-trade window |
| Per-trade volatility | Consistency of trade outcomes | No single trade exceeds 2× average win |
| Expectancy | Average profit per trade after losses | Positive; above zero net of costs |
A flattening curve across roughly 30 trades is an early warning of regime change. Do not wait for a breach to act.
How to protect and improve your equity curve during a challenge
A solid risk plan built before you enter a challenge is worth more than any in-challenge adjustment.
Pre-challenge checklist:
- Backtest your strategy and record its historical max drawdown.
- Choose a firm whose total drawdown limit is at least double your historical max.
- Set a position-size ceiling: no single trade risks more than 1% of account balance.
- Define your daily stop: if you lose 2% in a session, close the platform for the day.
In-challenge monitoring rules:
- Apply a moving average filter to your per-trade equity. When equity drops below the moving average, reduce position size accordingly.
- Resume full size only after equity recovers above the moving average for three consecutive trades.
- After any payout, drop to micro-lot sizing immediately and rebuild a 1.5–2% in-account buffer before returning to normal size.
- Review your journal every 10 trades: if your filtered trade subset outperforms your total curve by a wide margin, cut the marginal setups entirely.
Pro Tip: Set your position-size ceiling in your trading platform as a hard lot limit, not just a mental note. A rule you can override under pressure is not a rule.
The risk management guide for funded traders on TopPropOffers covers position-sizing templates in detail.
Common equity-curve traps that cause funded evaluation failures
Most account failures are not random. They follow predictable patterns.
- Post-payout overtrading: After receiving a payout, many traders return to full size immediately. The ~40% spike in daily drawdown violations after payouts is well-documented. Immediate action: drop to micro-lot sizing and rebuild a 1.5–2% buffer first.
- Sizing creep: Position size drifts upward as the account grows, inflating curve volatility until one loss is catastrophic. Immediate action: audit your last 10 trades for lot-size consistency.
- Ignoring trailing drawdown resets: Traders celebrate a new equity high without recalculating how much room they have left. Immediate action: after every new high, recalculate your remaining drawdown buffer before the next trade.
- Spike-and-crash behavior: One outsized win tempts a trader to repeat the same high-risk setup. The curve spikes, then crashes. Immediate action: cap any single trade at your standard risk percentage, regardless of conviction.
- Ignoring daily loss limits: A slow bleed across multiple small losses in one session adds up to a daily breach. Immediate action: set a hard session stop at 2% and honor it.
Review the Finotive Funding rules page on TopPropOffers for a clear example of how daily loss and drawdown rules are worded across firms.
How challenge timelines and fees shape your curve behavior
Most prop-firm challenges typically run from a few weeks to a couple months for a standard two-phase evaluation, or have no fixed time limit for one-step formats. Comparing challenge formats side by side shows the difference clearly.
A tight deadline creates curve pressure. Traders behind on their profit target tend to increase size late in the evaluation, which is exactly when the curve becomes most volatile and most likely to breach a drawdown rule. Entry fees for prop-firm challenges vary widely but generally represent a defined cost for accessing a funded account. That fee is not just a cost: it is the price of a defined risk environment where your curve behavior determines whether you get funded.
Shorter challenges demand a faster-climbing curve with tighter daily risk controls. Longer or unlimited-time formats reward patience and let a Staircase curve develop naturally. Match the challenge format to your trading style before you pay the fee.
How equity curve swings affect your decision-making
A declining curve does not just threaten your account balance. It changes how you trade. Traders watching a curve drop toward a drawdown limit tend to widen stops, add to losing positions, or switch strategies mid-challenge. Each of those responses makes the curve worse.
The fix is mechanical, not motivational. When your equity drops below the moving average, the rule tells you to cut size. You do not need to decide; the rule decides for you. That separation between emotion and execution is what keeps a Volatile Climber from becoming an Avalanche. Journaling every trade with a note on your emotional state at entry is one of the most underused tools in funded trading. Patterns in that data often reveal that your worst trades cluster around specific conditions: late in the session, after a loss, or when you are behind on a profit target.
Tools and platforms for tracking your equity curve
MetaTrader 4 and MetaTrader 5 both generate equity curve reports from trade history exports. For deeper analysis, platforms like Myfxbook and TradeZella let you overlay moving averages on your equity curve, filter by setup type, and compare your filtered curve against your total curve. Keeping real-time alerts on key equity levels adds another layer of protection during live sessions.
The most practical setup for a funded trader: export your trade history weekly, plot equity vs. balance side by side, and check whether your floating losses are staying within your historical drawdown profile. If your equity curve shows deep underwater spikes that your balance curve hides, you are holding losers too long.
Real-world curve management: what passes and what fails
Scenario A (pass): A trader runs a 30-day one-step challenge with a consistent 0.75% risk per trade. The curve climbs in a Staircase pattern, never drops more than 3% from peak, and hits the profit target on day 22. After the first payout, the trader drops to micro-lot sizing, rebuilds a 2% buffer over five trading days, then returns to normal size. The account scales without incident.
Scenario B (fail): A trader hits 7% profit by day 18, then takes three large trades to “lock in” the challenge. One reversal wipes 5% in a single session, breaching the trailing drawdown floor that had risen with the earlier equity high. The account closes. The mistake was not the loss itself; it was trading at full size after the trailing floor had risen to a point where a normal losing trade became a fatal one.
The difference between these two outcomes is not talent. It is curve awareness and a pre-set rule for what to do when equity approaches a danger zone.
Key Takeaways
Your equity curve shape predicts whether your strategy will survive a funded challenge, and a recovery factor of 3.0 or higher is the clearest signal of a resilient edge.
| Point | Details |
|---|---|
| Recovery factor target | Aim for net profit ÷ max drawdown of 3.0 or higher before entering any challenge. |
| Post-payout buffer rule | Drop to micro-lot sizing after every payout; rebuild a 1.5–2% buffer before returning to full size. |
| Moving average filter | Apply a 10–20 trade MA to your equity; cut size by 50% whenever equity drops below it. |
| Match firm limits to your curve | Your historical max drawdown should be no more than 50% of the firm’s allowed total drawdown limit. |
| TopPropOffers for firm selection | Use TopPropOffers’ 2026 firm rankings to match your curve profile to the right challenge rules before you pay a fee. |
What TopPropOffers’ 2026 reviews show about curves that pass
Across the 80+ firms reviewed on TopPropOffers for 2026, one pattern stands out: firms with strict trailing drawdown rules consistently select for Staircase or shallow Volatile Climber curves among traders who pass and stay funded. That is not a coincidence. Tight trailing rules punish spike-and-crash behavior immediately, so only traders with controlled sizing and consistent setups survive long enough to receive a payout.
The practical implication is that your curve profile should drive your firm selection, not the other way around. If your historical curve is a Volatile Climber with occasional deep drawdowns, a firm with a generous static drawdown limit and no trailing rule gives you a better structural fit than one with a tight trailing floor. TopPropOffers’ verified rule breakdowns make that comparison straightforward.
Traders who treat the equity curve as a diagnostic tool before they enter a challenge, not just a scoreboard during one, consistently outperform those who focus only on profit targets.
Find a firm that fits your equity-curve profile

TopPropOffers reviews 80+ prop firms with verified 2026 rule data, so you can match your historical drawdown profile to a firm’s actual limits before you pay an entry fee. Check the WeMasterTrade review for traders who want a trailing-drawdown structure with clear rules. For a broader comparison by challenge format, the challenge comparison page breaks down 1-step, 2-step, and instant funding options side by side.
Most firms on TopPropOffers accept code TOPPROP for a discount on enrollment fees. Exceptions: WeMasterTrade uses TOPPROP30, and Instant Funding uses TPO18. FTMO carries no code. For any firm not listed here, visit its TopPropOffers review page for the current verified code.
One practical reminder: after your first payout, do not withdraw your full balance. Leave a 1.5–2% buffer in the account before you resume trading. Visit TopPropOffers to compare firms, read verified rule breakdowns, and find the challenge that fits your curve.
Useful TopPropOffers pages for firm rules and examples
- Risk Management for Funded Traders: Complete Guide — position sizing, drawdown rules, and equity-curve monitoring
- Best Prop Firms in 2026: Ranked by Payouts, Rules & Reliability — firm rankings with verified rule data
- Finotive Funding Trading Rules & Conditions — detailed rule-break examples
- WeMasterTrade Review — trailing drawdown structure and TOPPROP30 code
- Why Most Traders Fail Funded Account Challenges — behavioral and structural failure patterns
All rule summaries are current for 2026. Click any firm page for exact terms and verified promo codes.
FAQ
What is an equity curve in funded trading?
An equity curve is a chronological chart of your account’s value over time, incorporating both realized profits and unrealized floating positions. In funded trading, it is the primary signal prop firms use to assess your risk management discipline.
What recovery factor should I target for a prop-firm challenge?
Aim for a recovery factor of 3.0 or higher, meaning your net profit is at least three times your maximum drawdown. Below 1.0 signals a fragile strategy that is unlikely to survive a challenge.
Why do so many traders fail right after a payout?
Post-payout periods see roughly a 40% increase in max daily drawdown violations. The most common cause is returning to full position size before rebuilding an in-account buffer. Drop to micro-lot sizing first and rebuild 1.5–2% before resuming normal risk.
How does trailing drawdown differ from static drawdown?
Static drawdown measures your loss from the starting balance. Trailing drawdown rises with every new equity high, so your safe zone shrinks as you profit. Always recalculate your remaining buffer after a new equity peak.
How long does a typical prop-firm challenge take?
Most prop-firm challenges typically run from a few weeks to a couple months for a standard two-phase evaluation, or have no fixed time limit for one-step formats. The challenge comparison page on TopPropOffers shows current timelines across formats.
What tools can I use to track my equity curve?
MetaTrader 4 and MetaTrader 5 export trade history for curve analysis. Platforms like Myfxbook and TradeZella let you overlay moving averages and filter by setup type. Pair these with real-time price alerts to monitor key equity levels during live sessions.
How do I choose a prop firm that matches my curve profile?
Your historical max drawdown should be no more than 50% of the firm’s allowed total drawdown limit. If your curve is a Volatile Climber, prioritize firms with static rather than trailing drawdown rules. TopPropOffers’ 2026 firm rankings include verified drawdown structures for each firm.
What is the moving average filter for equity curves?
Apply a 10–20 trade moving average to your per-trade equity. When your equity drops below that average, cut position size by 50% until equity recovers above the line for three consecutive trades. This mechanical rule removes emotion from sizing decisions.